Debugging in Spring Boot
 Photo by Samuel Myles on Unsplash
Spring Boot is an awesome way to build robust APIs fairly quickly. Its speed lies in the simplicity to run the apps like simple Java Programs. This article aims to help with debugging in Spring Boot Applications.
magic, a quality of being beautiful and delightful in a way that seems remote from daily life.
For the sake of clarity, we will run the application via command line to understand better & avoid the IDE magic for the time.
 Running Spring Boot application
Usually we run Spring application using the Gradle Wrapper Script gradlew available in any Boot Application with bootRun task.
./gradlew bootRun
 Debugging Spring Boot
You will find a lot of ways to debug Spring Boot Applications, here are the ones that I use often & find simple to use.
 Debug using –debug-jvm argument
- The first straight-forward way is to pass
--debug-jvmflag while runningbootRuntask:./gradlew bootRun --debug-jvm - It will now print the port it is listening to & wait for you to connect your IDE to that port:
Listening for transport dt_socket at address: 5005 - Head over to your IDE & create a debug configuration to attach to that port.
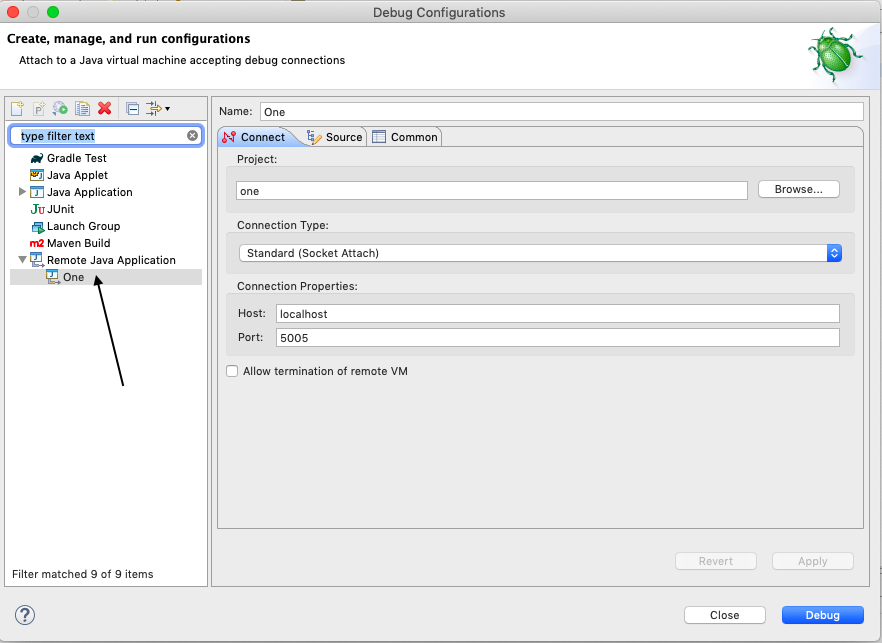
- For Eclipse IDE open Debug Configurations, go to Menu -> Run -> Debug Configurations.
- Double click Remote Java Application to create a new configuration.
- Select a project for that configuration.
- Connection Type should be Socket Attach.
- Host will be localhost, port will be whatever that is printed while starting the application, i.e. 5005.
- Click Apply & then Debug.

- It is only after you connect, the Spring Boot application will start.
 Debug using extended Gradle bootRun task
- In this option, you get to choose a debug port of yout choice.
- We will be extending the
bootRungradle task & provide JVM arguments to it. - Edit your
build.gradle& add below task:bootRun { jvmArgs=["-agentlib:jdwp=transport=dt_socket,server=y,suspend=y,address=14001"] } - Set the
addressoption to whichever port you need. - Start your application with
bootRunwithout any arguments:./gradlew bootRun - You can also let the application start up without waiting for an IDE to attach by setting the
suspend=nin the arguments. - Rest of the steps remain identical for creating & debug configuration & attaching the IDE to your Spring Boot Application.
 Debug when running as jar
- In this option, you can can debug the application running as a Spring Boot Jar
- Again the basics remain same, like letting Java know about the debug configuration followed by configuring your IDE
- The command you use to run the Spring Jar is:
java -jar <spring-applicaiton.jar> - To debug just add these java options before
-jaroption-Xdebug -Xrunjdwp:transport=dt_socket,address=14001,server=y,suspend=yjava -Xdebug -Xrunjdwp:transport=dt_socket,address=14001,server=y,suspend=y -jar <spring-application.jar> - Now in your IDE configure a Remote Application Debug configuration to connect to above port.
Hope this information helped you. Please feel free suggest any edits through issues in my git repository.

